Varshini Srinivas
I’m a data scientist with a background in consulting, industrial engineering, and operations research. I love storytelling with data using 🐍 Python, 📊 Tableau, and 💾 SQL. In my spare time, I love to 🍳 cook, make 🎨 linocut prints, and volunteer at 🐾 Muttville SF!
Sentiment Analysis on Spotify Data and Recommendation System
Author: Varshi S, 9 minute read.
Click below to see the Jupyter Notebooks for this project!
Prototype Available: Check out the mood-based recommendation system prototype by clicking below!
Project Overview
This project aims to perform sentiment analysis on Spotify data to build a personalized recommendation system. By analyzing the emotional qualities of music, the project seeks to enhance personalized listening experiences and provide insights into user preferences.
Data Pipeline Flowchart
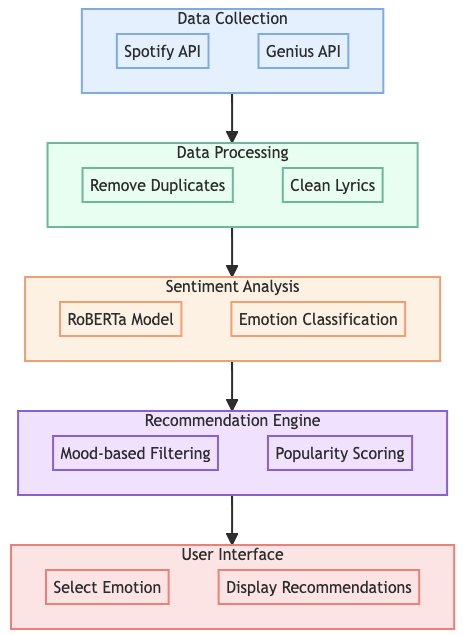
To provide a clear picture of how our Spotify sentiment analysis and recommendation system works, I’ve created a visual representation of the data pipeline. This flowchart illustrates the main steps of my process, from initial data collection to the final user interface:
-
Data Collection (Blue): I begin by gathering data from two primary sources - the Spotify API for user listening history and the Genius API for song lyrics.
-
Data Processing (Green): In this stage, I clean and prepare the data. This involves removing duplicates from the Spotify data and cleaning the lyrics obtained from Genius.
-
Sentiment Analysis (Orange): Here, I use a RoBERTa model to analyze the cleaned lyrics and classify the emotions expressed in each song.
-
Recommendation Engine (Purple): This is where the magic happens. I combine mood-based filtering with popularity scoring to generate personalized song recommendations.
-
User Interface (Red): Finally, we present our results to the user. They can select their current mood, and the system will display tailored song recommendations.
The Data
- Timeframe: April 2016 - August 2024
- Attributes: Musical history data, including track names, artists, genres, tempo, release date, lyrics, and sentiment scores
Motivation & Hypothesis:
Understanding the emotional impact of music is essential in today’s music landscape. This analysis aims to uncover how sentiment influences music preferences and listener engagement, ultimately leading to a more personalized recommendation system.
Key Focus Areas
1. Data Collection
Overview: I gathered historical musical data from Spotify using Exportify.
Steps Taken:
- Collected personal listening history, including track metadata (name, artist, album, duration).
- Filtered and removed duplicate songs to ensure data integrity.
Tools Used:
- Libraries: spotipy (for Spotify API interaction), pandas (for data manipulation), and numpy (for numerical operations).
- Method: Deduplication was handled using pandas’
drop_duplicates()method.
2. Lyrics Fetching
Approach: I fetched song lyrics via the Genius API by matching track names and artist information.
Challenges:
- Faced API rate limits, which required batching requests.
- Some API responses were slow or incomplete, leading to missing lyrics.
- Some songs were not matched to lyrics at all, or were not in English
- Regex was required was fairly complicated and could use some fine-tuning
3. Data Cleaning
Method: I used regular expressions (regex) to clean up the fetched lyrics, removing unwanted characters and formatting anomalies (e.g., brackets, newlines, special symbols).
Example:
- Raw:
"[Verse 1] I'm walking on sunshine! (Yeah, yeah)" - Cleaned:
"I'm walking on sunshine"
This cleaning process was essential to prepare the lyrics for sentiment analysis.
Here are some before and after images:
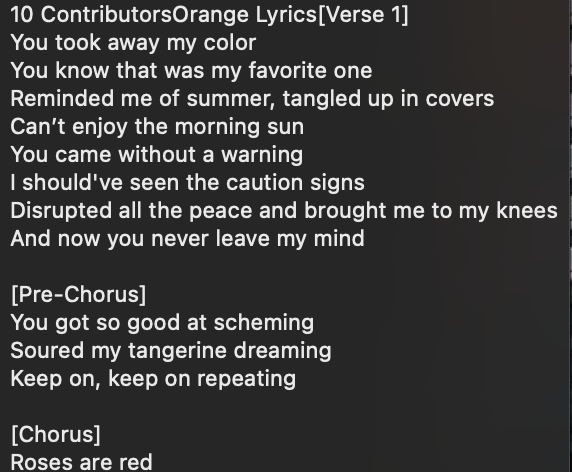
Lyrics Before Cleaning
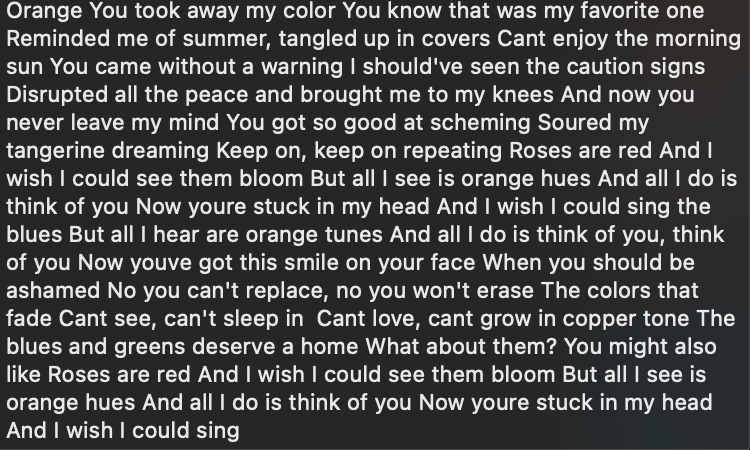
Lyrics After Cleaning
Note: I also had to identify if the Genius API scraped something that did not look like lyrics entirely. Here are some examples of that:
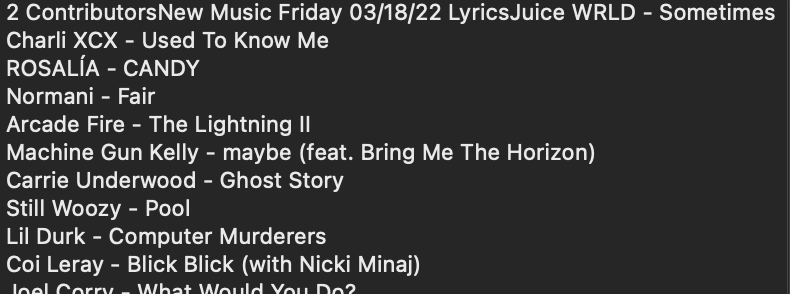
Only Track Names and Artist Names (No Lyrics)
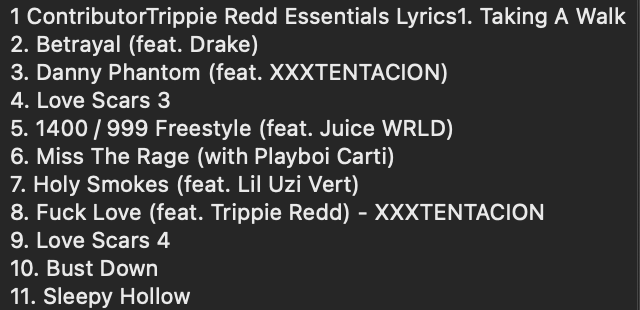
Track Names and Artist Names as Numbered List (No Lyrics)
Code Snippet of Data Preparation:
def clean_lyrics(lyrics):
    # Remove anything within square brackets (like [Chorus], [Verse])
    lyrics = re.sub(r'\[.*?\]', '', lyrics)
    # Remove phrases indicating contributors to the lyrics (case insensitive)
    lyrics = re.sub(r'\b\d+\s+contributor(?:s)?\b', '', lyrics, flags=re.IGNORECASE)
    # Remove the word 'translation'
    lyrics = re.sub(r'\btranslation\b', '', lyrics, flags=re.IGNORECASE)
    # Remove any non-ASCII characters (such as emojis or special symbols)
    lyrics = re.sub(r'[^\x00-\x7F]+', '', lyrics)
    # Remove empty lines from the lyrics
    lyrics = '\n'.join([line for line in lyrics.split('\n') if line.strip()])
    return lyrics.strip()  # Return the cleaned lyrics, stripped of extra spaces
Sentiment Analysis
Implementation: Utilized a pre-trained transformer model from Hugging Face with PyTorch for sentiment analysis. In this post, I’ll explore how to analyze the emotions expressed in song lyrics using a machine-learning model. We’re working with a model called roberta-base-go_emotions (click the link to see more detailed documentation on HuggingFace), which can identify 28 different emotions based on the lyrics (e.g. Love, Anger, Fear, etc.) provided, giving richer detail than a simple “Positive”, “Negative” and “Neutral” assessment. However, this model has a limitation: it can only process up to 512 tokens (words or parts of words) at a time.
To get around this limitation, I use a technique called the sliding window approach using PyTorch. This method involves breaking the lyrics into overlapping sections, allowing us to analyze the entire song, even if it exceeds 512 tokens. The result is a clear understanding of the emotions in the lyrics, which can be useful for artists, producers, and fans alike.
Code Snippet of Sentiment Analysis Window Function:
import torch
from transformers import AutoTokenizer, AutoModelForSequenceClassification
import pandas as pd
from torch.nn.functional import softmax

# Load the tokenizer and model for emotion classification
tokenizer = AutoTokenizer.from_pretrained('SamLowe/roberta-base-go_emotions')
model = AutoModelForSequenceClassification.from_pretrained('SamLowe/roberta-base-go_emotions')
model.to('cuda' if torch.cuda.is_available() else 'cpu')

def sliding_window_sentiment_analysis(text, window_size=512, stride=256):
    # Tokenize and prepare input tensors
    inputs = tokenizer(text, return_tensors='pt', truncation=False)
    input_ids = inputs['input_ids'].squeeze()

    # Calculate number of sliding windows
    num_windows = max(1, (input_ids.size(0) - window_size) // stride + 1)
    all_logits = []

    # Process each sliding window
    for i in range(num_windows):
        window_input_ids = input_ids[i*stride:i*stride + window_size].unsqueeze(0)
        attention_mask = torch.ones_like(window_input_ids).to(model.device)

        with torch.no_grad():
            outputs = model(window_input_ids, attention_mask=attention_mask)
        all_logits.append(outputs.logits)

    # Average the logits and compute probabilities
    aggregated_logits = torch.mean(torch.stack(all_logits), dim=0)
    probs = softmax(aggregated_logits, dim=1)

    # Get predicted class and confidence score
    predicted_class = torch.argmax(probs).item()
    confidence = probs[0][predicted_class].item()

    return model.config.id2label[predicted_class], confidence

# Example usage
lyrics_list = df['Lyrics_Clean'].astype(str).tolist()
results = [{'label': sliding_window_sentiment_analysis(lyrics)[0],
            'score': sliding_window_sentiment_analysis(lyrics)[1]} for lyrics in lyrics_list]

# Convert results to a DataFrame
lyrics_sentiment = pd.DataFrame(results)
print(lyrics_sentiment)

# Add sentiment results to the original DataFrame
df['Sentiment_Label'] = lyrics_sentiment['label']
df['Sentiment_Score'] = lyrics_sentiment['score']
Explanation of the Sliding Window Method
- The process starts with a long text input (like song lyrics).
- The text is split into overlapping windows. Typically, the window size is 512 tokens, and the stride (overlap) is 256 tokens.
- Each window is processed separately by the sentiment analysis model.
- The results from all windows are averaged to get the final sentiment.
The “Sliding Window Process” subgraph at the bottom shows how the windows overlap:
- Window 1 covers the first chunk of text.
- Window 2 starts halfway through Window 1 and covers the next chunk.
- Window 3 starts halfway through Window 2 and covers the next chunk.
This process continues until the entire text is covered. By using overlapping windows, the algorithm ensures that no part of the text is analyzed in isolation, which helps to maintain context throughout the analysis.
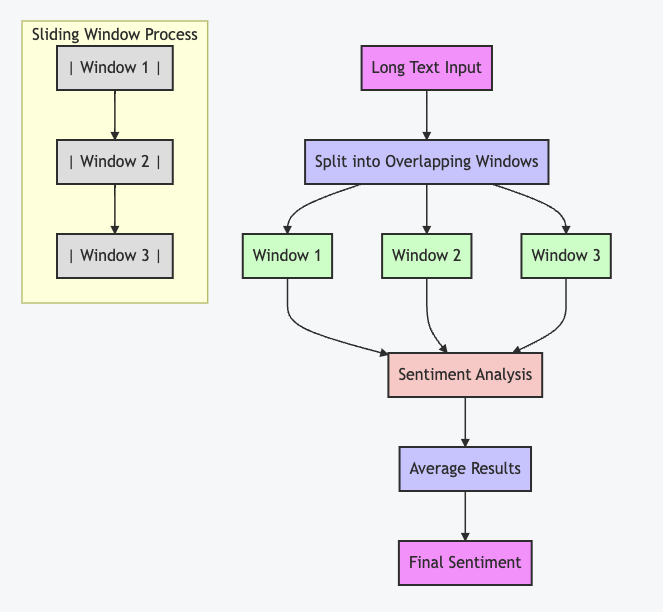
Sliding Window Implementation Details
The main steps in the code that implement this process are:
- The
sliding_window_sentiment_analysisfunction processes the text in chunks. - It calculates the number of windows based on the text length, window size, and stride.
- For each window, it runs the sentiment analysis model and stores the results.
- Finally, it averages the results from all windows to get the final sentiment and confidence score.
This technique is particularly useful for long texts that exceed the maximum input size of the sentiment analysis model, allowing for comprehensive analysis of the entire text while maintaining local context.
- Results: Classified song lyrics into one of 28 distinct sentiment categories (Love, Fear, Disappointment, Sadness, Nervousness, Annoyance, Disapproval, Disgust, Neutral, … Relief, Gratitude, Pride), forming the basis for the mood-based recommendation system. The model assigned a sentiment based on the sentiment with the highest probability of being present among the 28 emotions the model was trained on.
From the visualization, I noticed that the “Neutral” sentiment dominates, which aligns with my observation that the Genius API did not always consistently scrape lyrics correctly. This prevalence of neutral sentiment suggests there may be some areas for improvement in my data extraction and cleaning process. After reflecting on the results, I’ve come up with a few possible reasons and ideas for refinement:
-
Data granularity:
My current sentiment analysis might not be capturing the full emotional depth of the lyrics. To address this, I could try a more fine-grained emotion classification model or adjust the thresholds for what gets labeled as neutral. -
Context sensitivity:
Song lyrics often use metaphors, irony, and complex emotional themes that general-purpose sentiment analysis models might struggle to interpret. Fine-tuning my model on a dataset specific to song lyrics could help improve its accuracy. -
Sliding window approach:
I’m currently using a sliding window to analyze sentiment and then averaging across the windows. This might be smoothing out more pronounced emotions in certain parts of the lyrics. I could experiment with different aggregation methods, like using the maximum sentiment score instead of the average, to capture these more intense emotions. -
Preprocessing:
It’s also possible that my data cleaning process is unintentionally stripping out important emotional cues. I plan to review my preprocessing steps to ensure I’m not neutralizing text that holds meaningful sentiment. -
Model selection:
I’m using the ‘SamLowe/roberta-base-go_emotions’ model, which might not be the best fit for analyzing song lyrics. I could experiment with other pre-trained models that are better suited for detecting emotions in creative, lyrical text. -
Threshold adjustment:
Another option is adjusting the threshold for classifying sentiment as neutral. By setting a higher minimum confidence score for non-neutral classifications, I might reduce the number of lyrics labeled as neutral.
How I plan to refine my analysis:
- Experimenting with different pre-trained models or fine-tuning the current model on a dataset of labeled song lyrics.
- Tweaking the sliding window parameters (window size and stride) to see if that improves how well sentiment is captured.
- Trying a more sophisticated aggregation method to better combine sentiments across different windows.
- Reviewing and refining the data cleaning process to ensure that important emotional cues in the lyrics are preserved.
- Exploring a multi-label classification approach, where a song can have multiple sentiment labels, each with varying intensities.
Sentiment analysis of song lyrics is a tricky task because of the creative and often ambiguous nature of the text. I know it’ll take some trial and error, but I’m confident that with a few more iterations, I’ll be able to improve the accuracy of my results. For now, I plan to continue with my project and refine as I go!
Recommendation System
- Concept: Built a bespoke, popularity, release date and mood-based recommendation engine where users pick a mood, and the system recommends songs based on historical sentiment analysis of lyrics.
- Algorithm: In this part of the project, we focus on recommending songs based on the user’s chosen mood or sentiment. The system uses the Spotify API to fetch song details and applies a custom popularity score based on how recently the song was released. This recommendation system is inspired by this post. Here’s a breakdown of the key features:
In this part of the project, the goal is to recommend songs based on the user’s selected mood or sentiment. The system gathers song details using the Spotify API and ranks them by how recently they were released, giving more weight to newer songs. Here’s a summary of the key features:
-
Popularity Based on Release Date: The system assigns a score to each song depending on how recently it was released. Newer songs receive higher scores, ensuring the recommendations highlight recent music while still including older tracks.
-
Normalizing Song Features: To make recommendations more accurate, the system adjusts different audio features—such as danceability, energy, and mood—so they are comparable. This helps in providing more balanced song suggestions.
-
Fetching Detailed Song Information: Using the Spotify API, the system pulls up detailed song information like the song title, artist, Spotify link, album cover, and a short preview. This adds more context to the recommendations.
-
Mood-Based Recommendations: The system filters songs based on their mood (or sentiment), giving users music that aligns with the emotional tone they’ve selected. This ensures the recommendations match the user’s current feeling.
-
Combining Mood and Popularity: In addition to matching the mood, the system considers how popular the song is. It combines the mood-based suggestions with the popularity score to give a more balanced recommendation list.
-
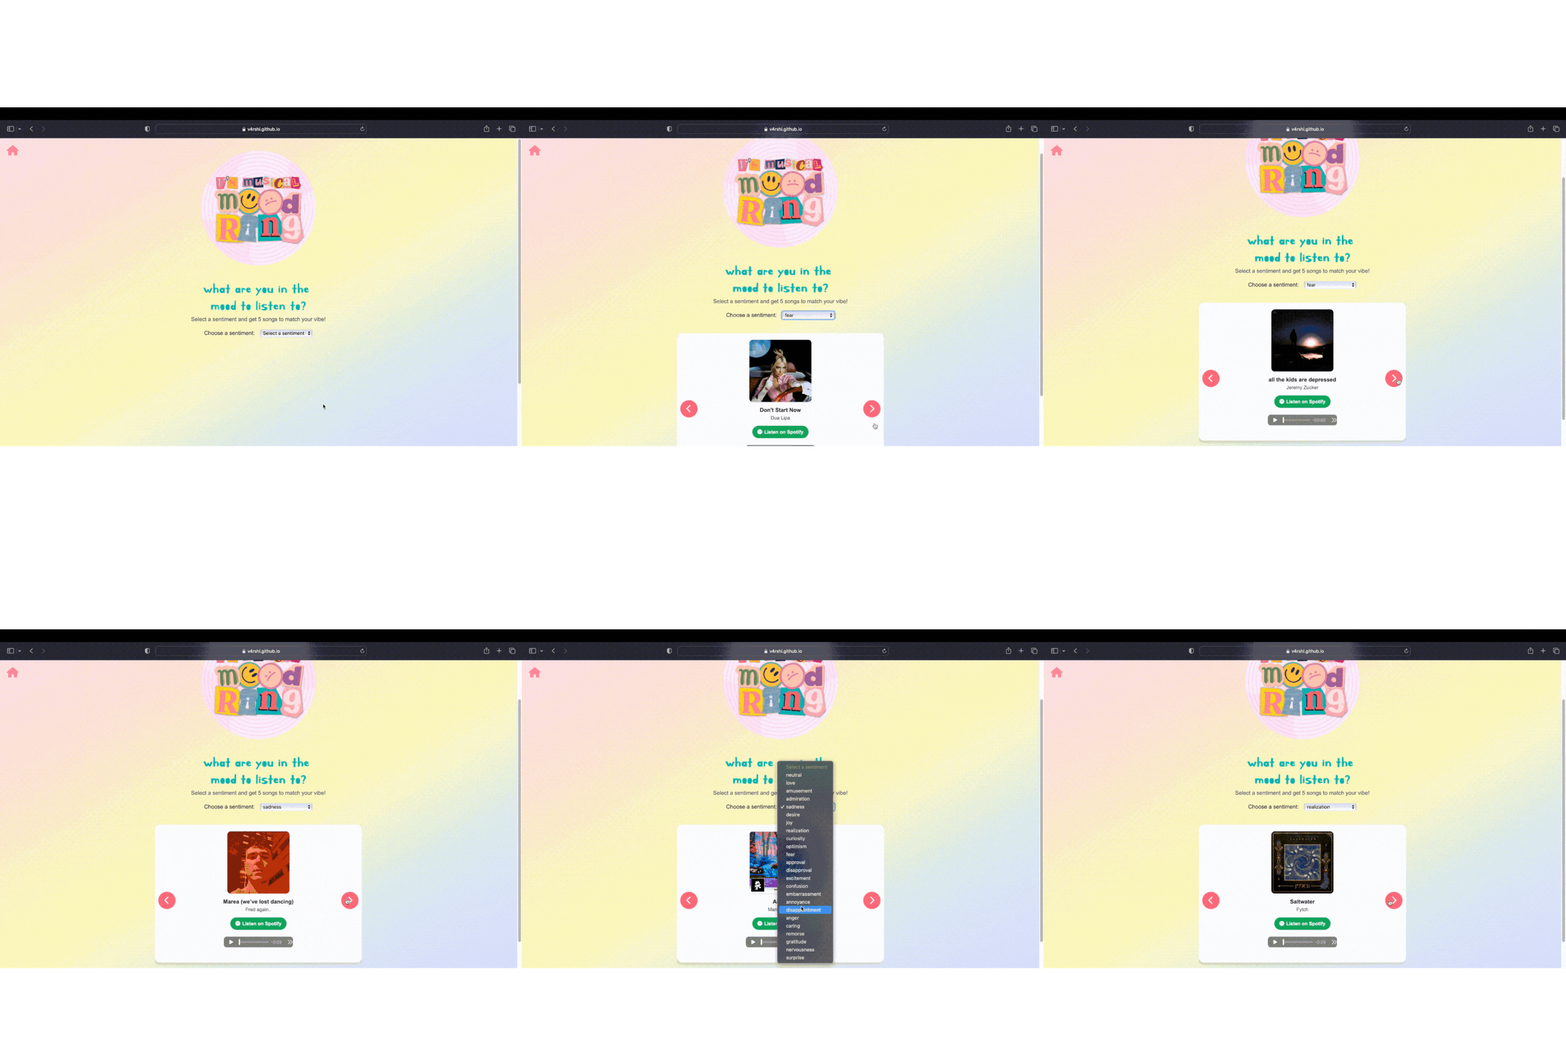
User-Friendly Mood Selection: A simple dropdown menu allows users to select their mood, and the system instantly shows songs that fit their emotional state.
This approach creates a dynamic recommendation system that not only tailors music to your mood but also keeps the results fresh by prioritizing newer tracks.
Key Code Snippet
# Calculate weighted popularity based on release date
def calculate_weighted_popularity(release_date):
    release_date = datetime.strptime(release_date, '%Y-%m-%d')
    time_span = datetime.now() - release_date
    weight = 1 / (time_span.days + 1)  # Newer songs get a higher score
    return weight
What It Does:
- Parse Release Date: Converts the song’s release date from a string to a date format.
- Calculate Time Span: Determines how many days have passed since the song was released.
- Assign Weight: Recent songs get a higher score using the formula
1 / (time_span.days + 1). Older songs get lower scores, but are still included in the recommendations.
This calculation helps balance between recommending popular songs and suggesting newer tracks that fit the user’s mood and filtering based on sentiment.
Interactive HTML Page
- Design:
- Created an intuitive HTML page where users can select an emotion from a list.
- Users are presented with a carousel of song recommendations featuring album art, a preview of the song, and links to listen on Spotify.
- Functionality:
- The page dynamically generates recommendations based on user sentiment input, enhancing the user experience with personalized music choices.
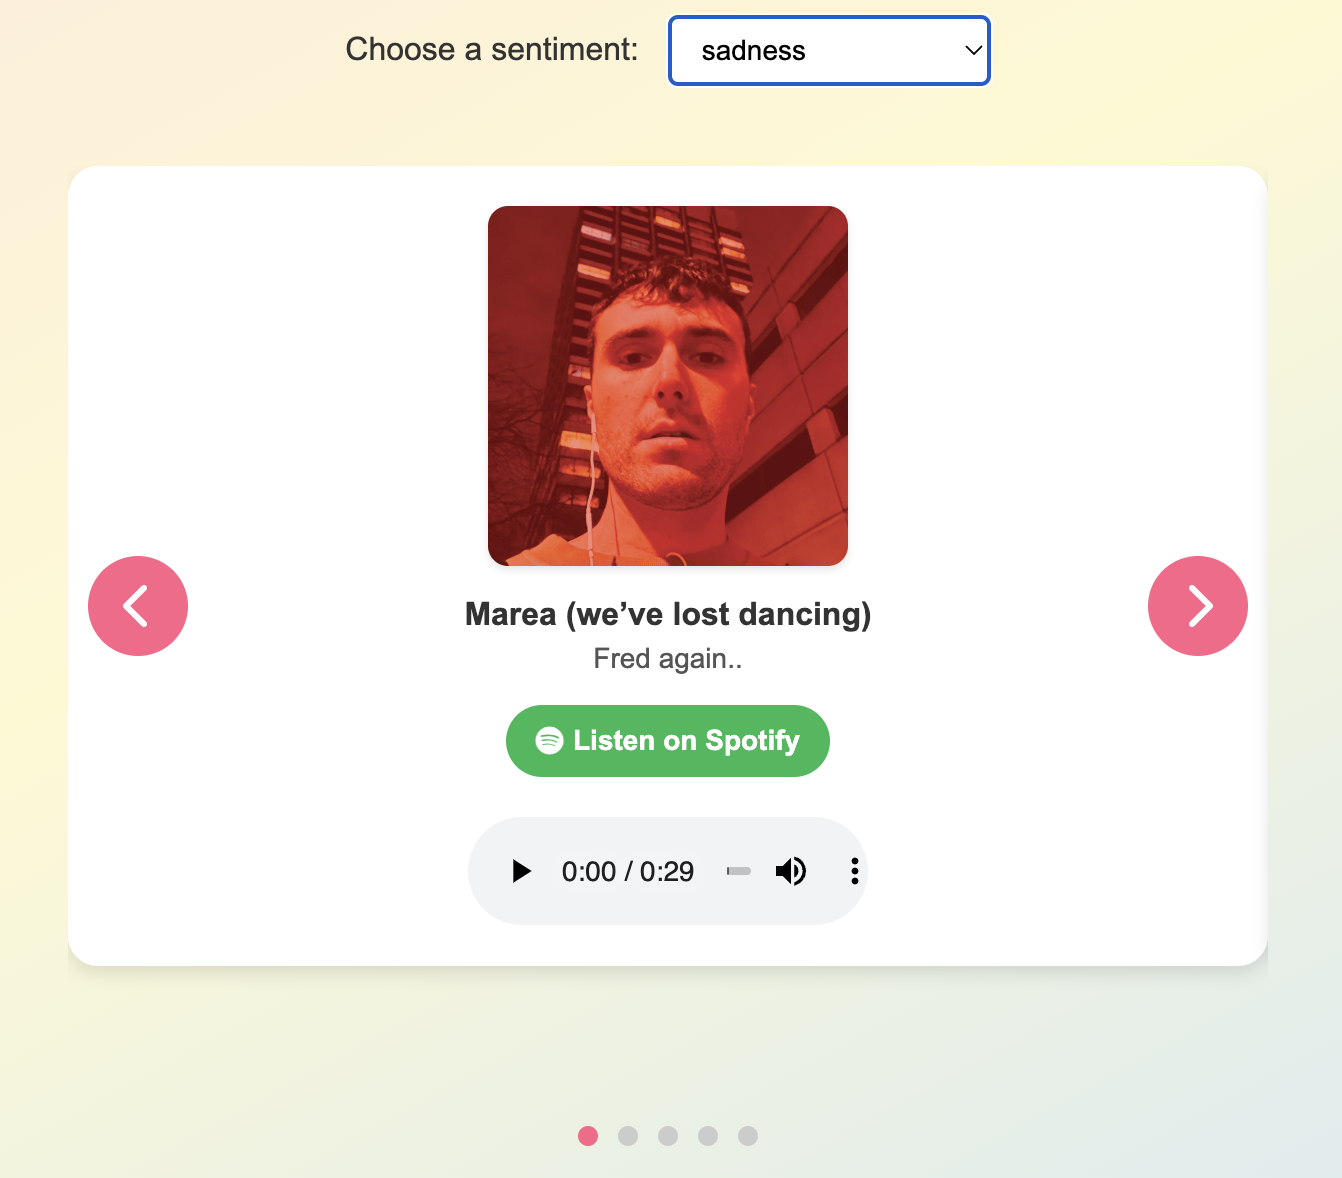
Example: The recommender presents one of five potential songs shown after selecting 'sadness', featuring 'Marea (we've lost dancing)' with album art and Spotify link.
UX Considerations for Carousel Design
- Focused on intuitive navigation and accessibility.
- Ensured a visually appealing, engaging layout for users.
- Provided clear feedback when users select an emotion or interact with the carousel.
- Included album art, a direct link to the song on Spotify, and when available provided users an audio clip preview of the song.
Next Steps
-
Improvements : Moving forward, I plan to fine-tune the recommendation algorithm to improve its accuracy. Additionally, I want to enhance the UI/UX to boost user engagement and interactivity, ensuring the platform feels more intuitive and enjoyable to use.
-
Applications of the Analysis : The sentiment analysis I’ve developed has the potential to make a meaningful impact by improving user experience on music platforms. Personalized recommendations based on emotional tone, mood, or individual preferences could transform how users discover music, making it feel more tailored to their current feelings and needs.
-
Ethical Considerations : As with any project involving user data, privacy concerns are a key issue to consider. I’ll be looking into ways to address these concerns responsibly, ensuring that user data is protected. It’s also important to evaluate the broader ethical implications of applying sentiment analysis in music recommendations, such as the potential for reinforcing certain moods or behaviors, and how to avoid biases in the recommendation system.
Conclusion and Key Takeaways
Diving into the world of NLP and recommendation systems through my Spotify data has been an illuminating journey. This project allowed me to grasp NLP fundamentals and experiment with PyTorch and LLM models but also challenged me to create a functional, albeit simple, recommender system for something I’m passionate about.
The experience extended beyond just data science, giving me valuable insights into front-end engineering with HTML and CSS, as well as UX/UI design. While I still have much to learn, I’ve gained a deep appreciation for how these diverse components come together to create engaging and user-friendly products that are delightful to use.
Interestingly, since starting this project, I’ve learned that Spotify plans to implement conversational AI for creating highly personalized playlists (read the article here). This development excites me and reinforces my belief in music’s transformative power. It’s thrilling to see how the concepts I’ve been exploring are applied at scale in the industry.
Perhaps the most significant takeaway from this experience is the power of hands-on learning. Immersing myself in this project has taught me more than any textbook could. It’s reaffirmed that the best way to learn is by doing – by facing real challenges and finding creative solutions.
I hope this blog post has been both informative and inspiring. Whether you’re a fellow data enthusiast, a music lover, or simply curious about the intersection of technology and art, I encourage you to embark on your own learning journey. Who knows what exciting discoveries await!
© Copyright of Varshini Srinivas